Grafana Cloud Tempo
Supported Data Types:
TraceRedMetricServiceInstanceTopology
This document describes how to integrate Trace, RedMetric, ServiceInstance, Topology data from Grafana Cloud Tempo into Syncause.
- You need access to a running Syncause service to complete this tutorial. For instructions, please refer to the "Setup" section.
- You need a Grafana Cloud account with Tempo enabled. For Grafana Tempo Community Edition, please refer to the document Grafana Tempo CE.
- Access Syncause's
Ingestion>External Data Sources> clickTempoto create a new Grafana Tempo data type.
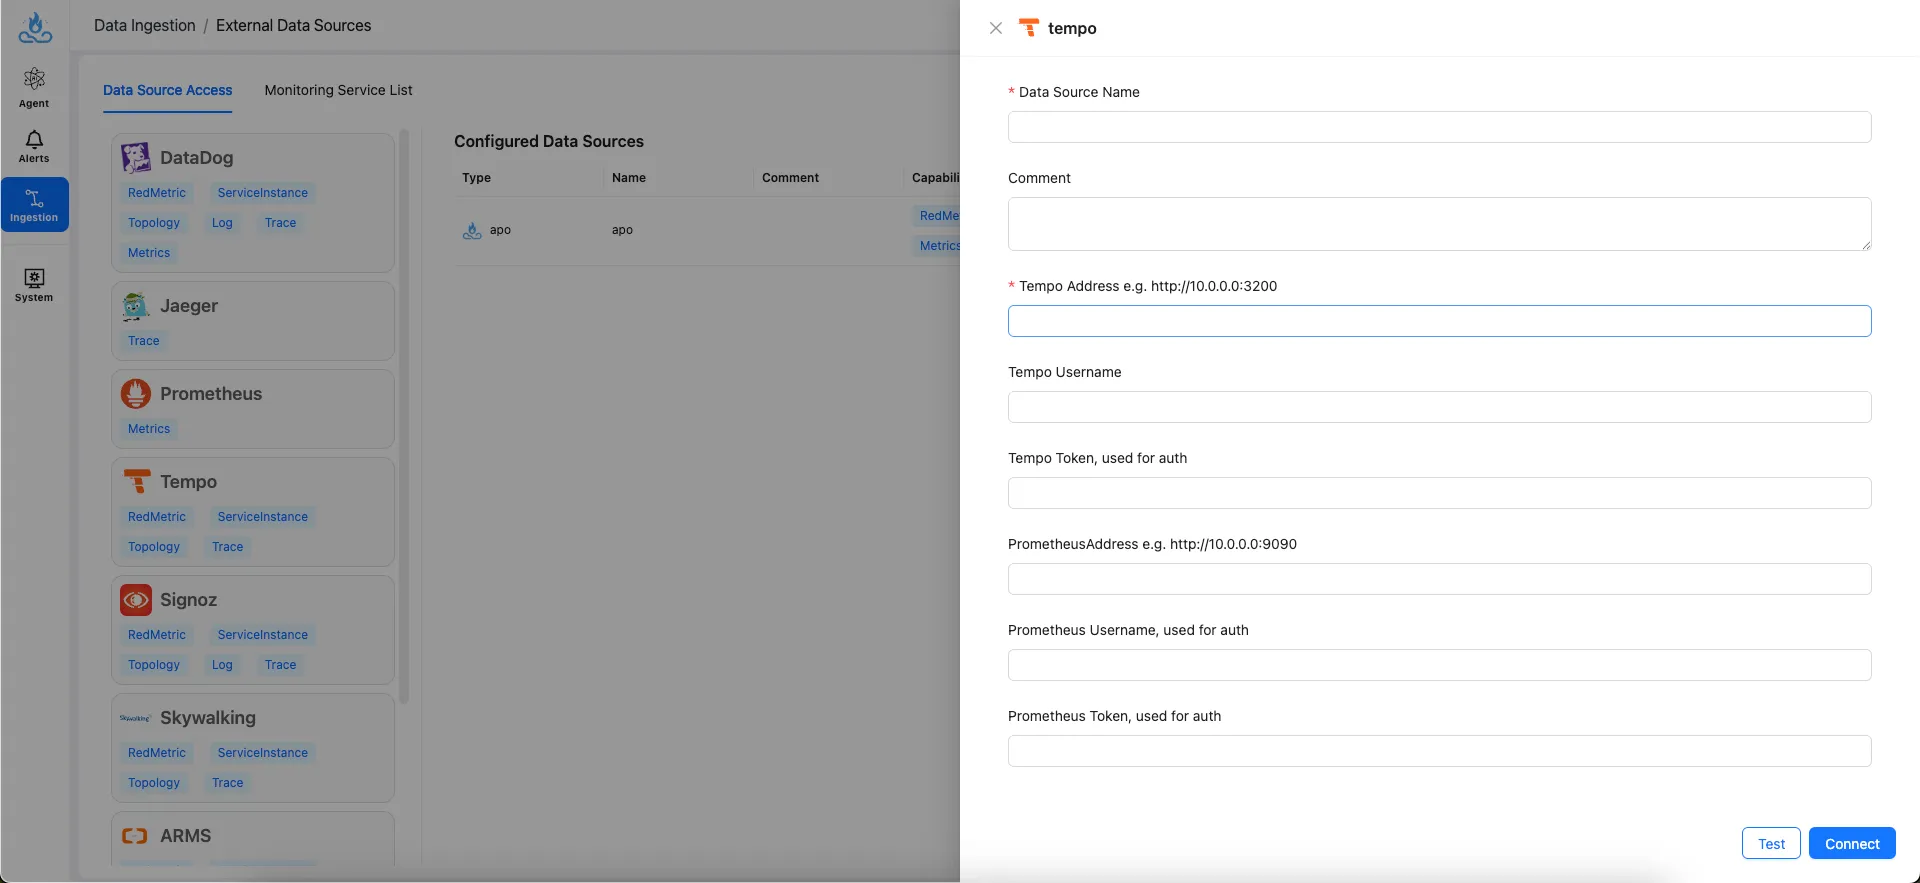
Field Description
| Field | Description | Example |
|---|---|---|
| Data Source name | Data Source Name | my-datadog |
| Comment | Data Source Comment | |
| Tempo Address | Grafana Tempo server address | http://tempo-xxxxxx-xxxx.grafana.net/tempo |
| Tempo Username | Tempo Username | 1234567 |
| Tempo Token | Tempo Access Token | |
| PrometheusAddress | (Optional) Prometheus address for querying topology | http://prometheus-xxxxxx-xxxx.grafana.net/api/prom/push |
| Prometheus Username | (Optional) Prometheus Username for querying topology | 1234567 |
| Prometheus Token | (Optional) Prometheus Access Token for querying topology |
Setup Guide
Step 1: Access your Grafana Cloud account
- Access to Grafana Cloud website and login your account.
- Click
My Accountin the upper right corner.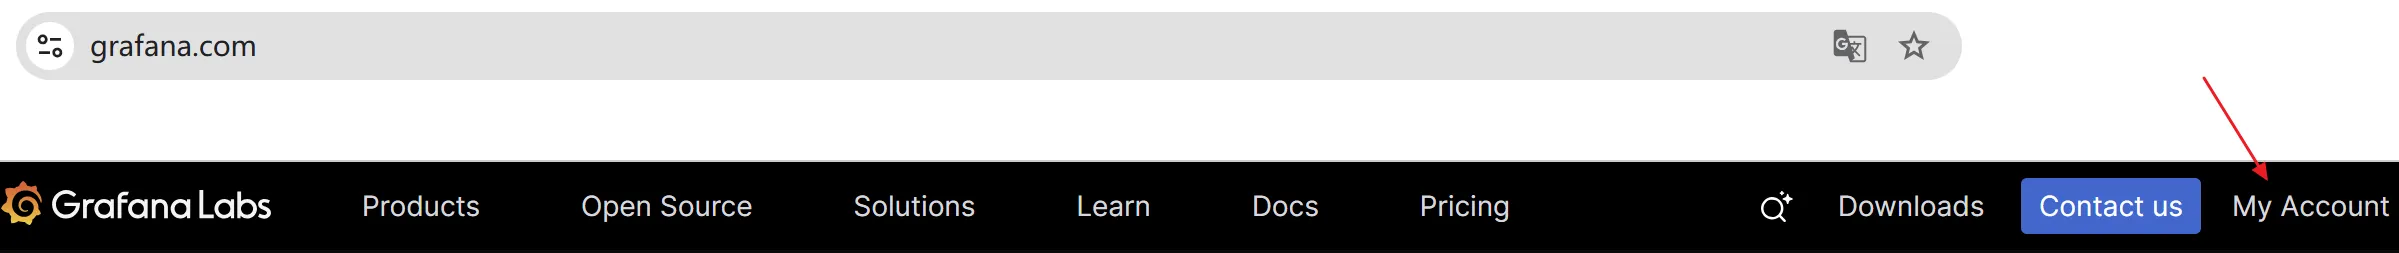
- Click
Detailsunder your Grafana Cloud stack section.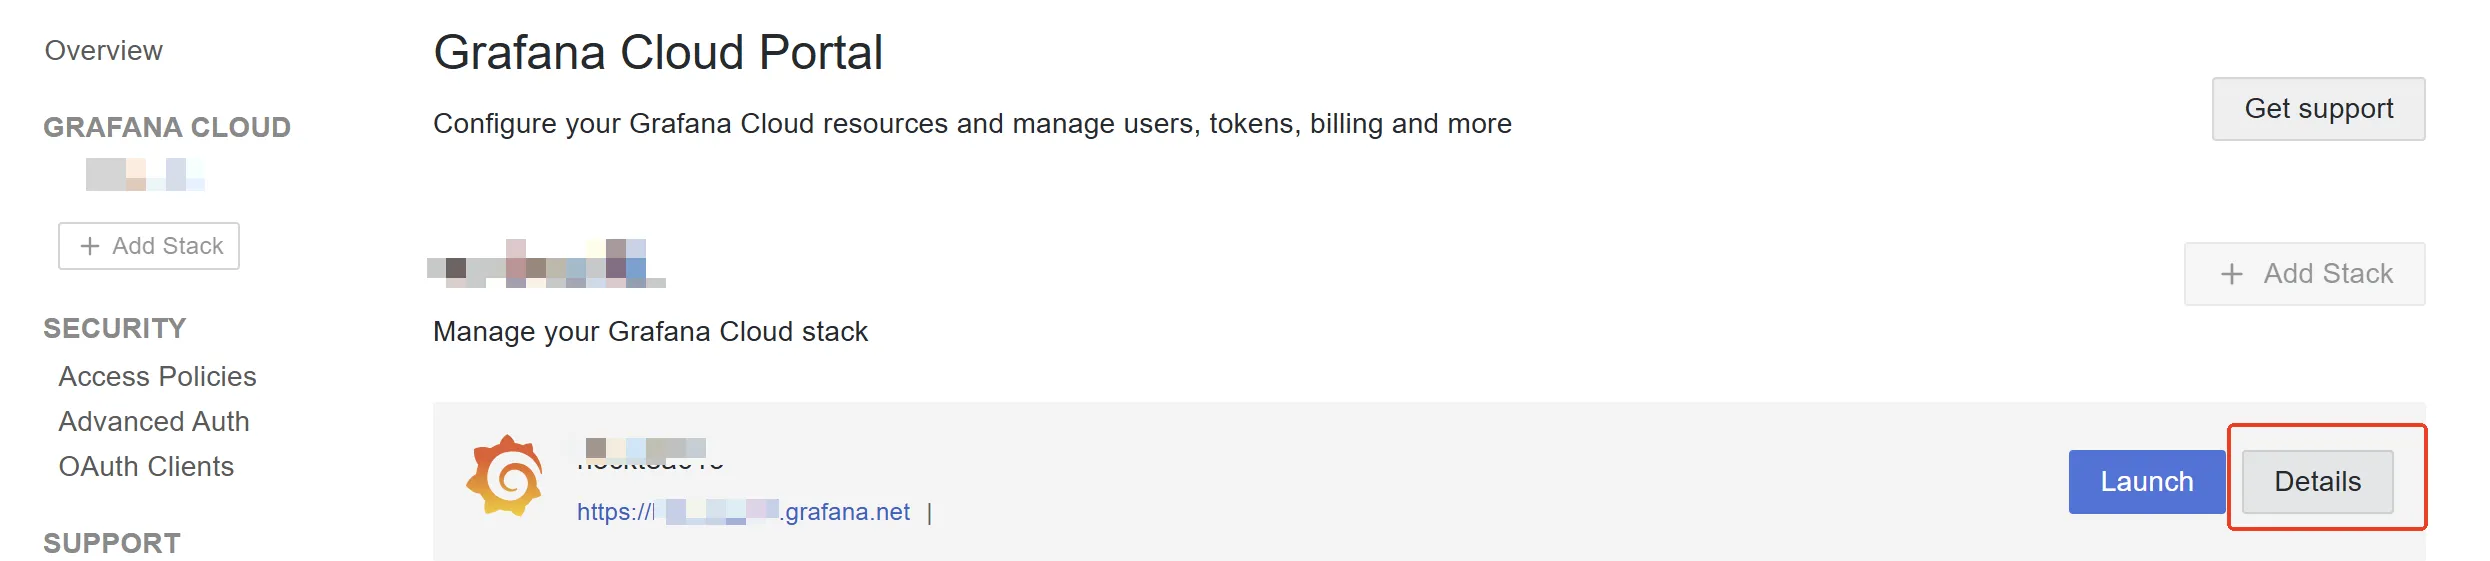
- Click
DetailsinTemposection.
Step 2: Get your tempo information
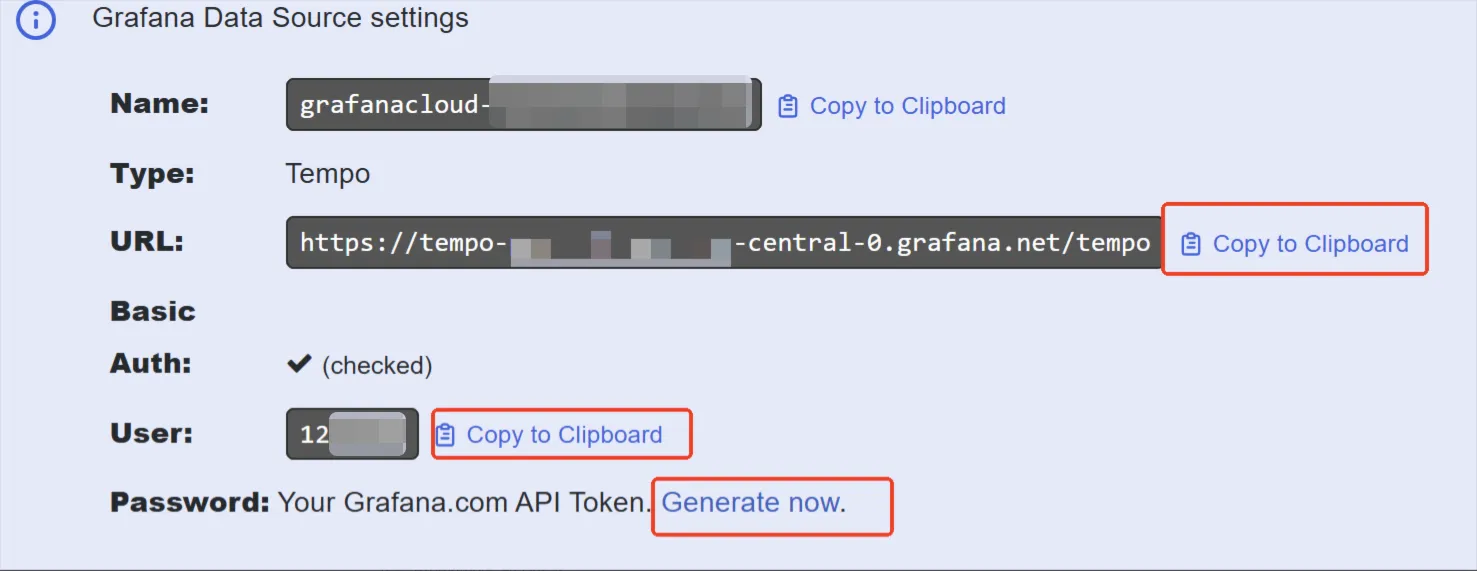
- Scroll down to
Grafana Data Source settingssection. - Generate an
Passwordif you don't have one. - Copy and paste the following values into the corresponding fields:
URLvalue intoTempo Addressfield;Uservalue intoTempo Usernamefield;Passwordvalue intoTempo Tokenfield.
(Optional) Step 3: Set up Prometheus integration for topology data
Grafana Cloud Tempo does not automatically generate Service Graph (topology) data. If the topology is missing, you can enable Observability -> Application to generate it. Please note that this may incur additional charges.
If Service Graph (topology) data is already available and you want to integrate it, please follow these steps:
- Open your Grafana Cloud stack and click
Detailsin thePrometheussection.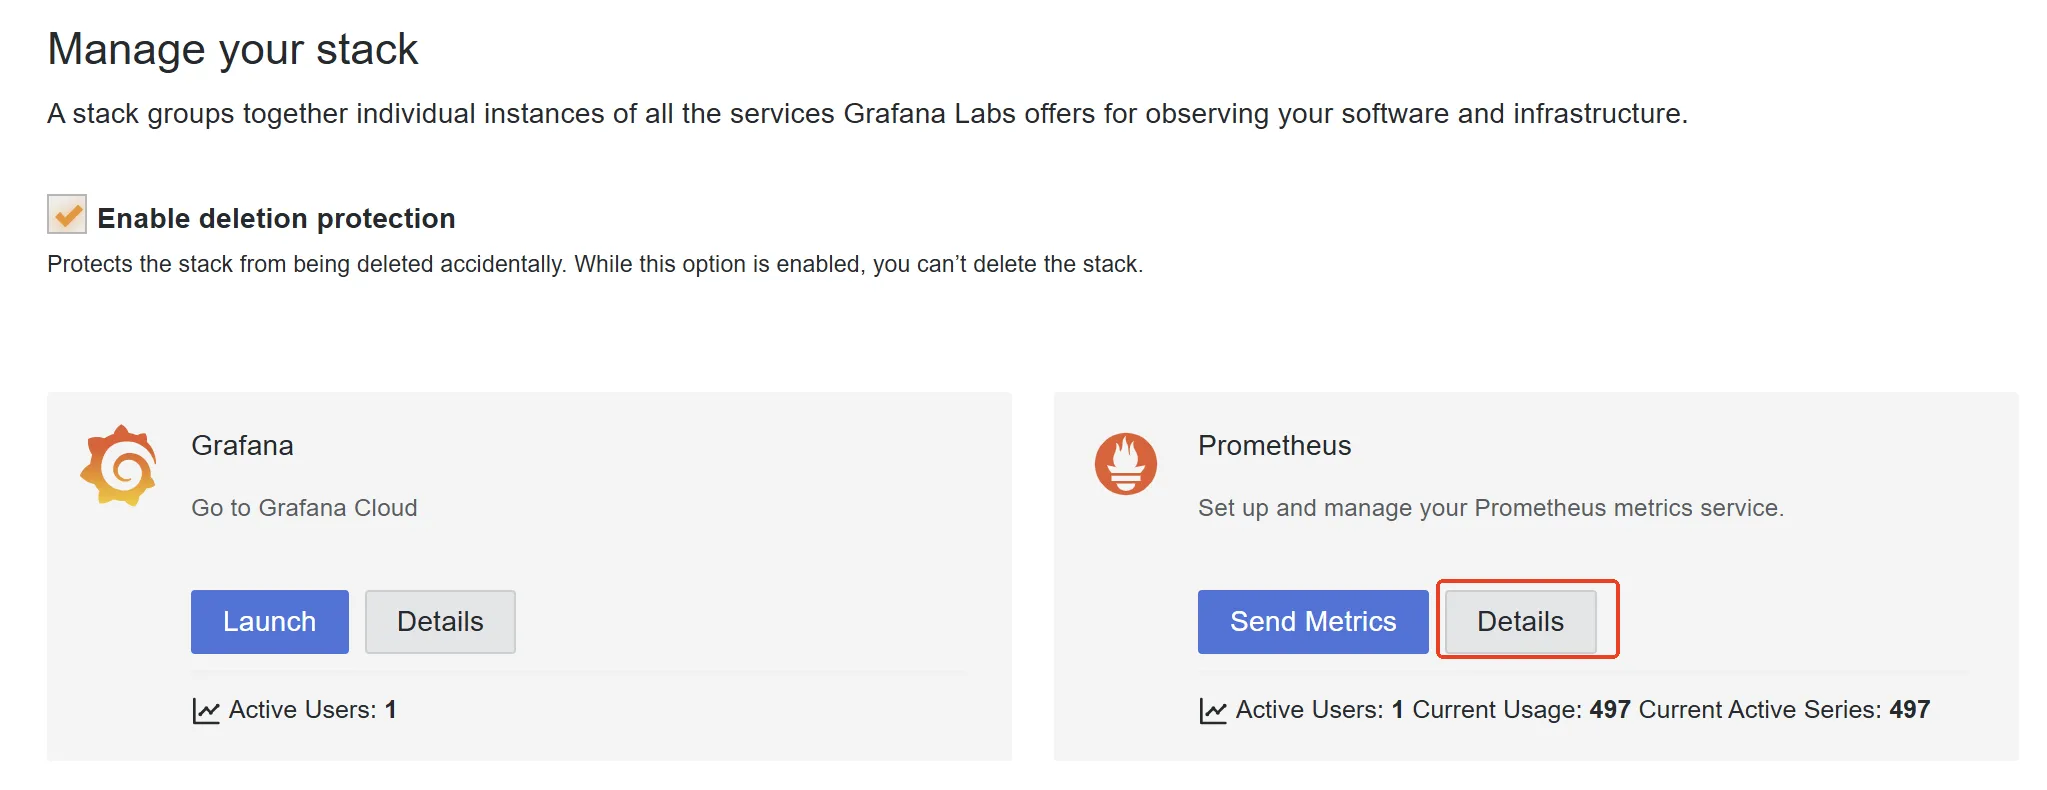
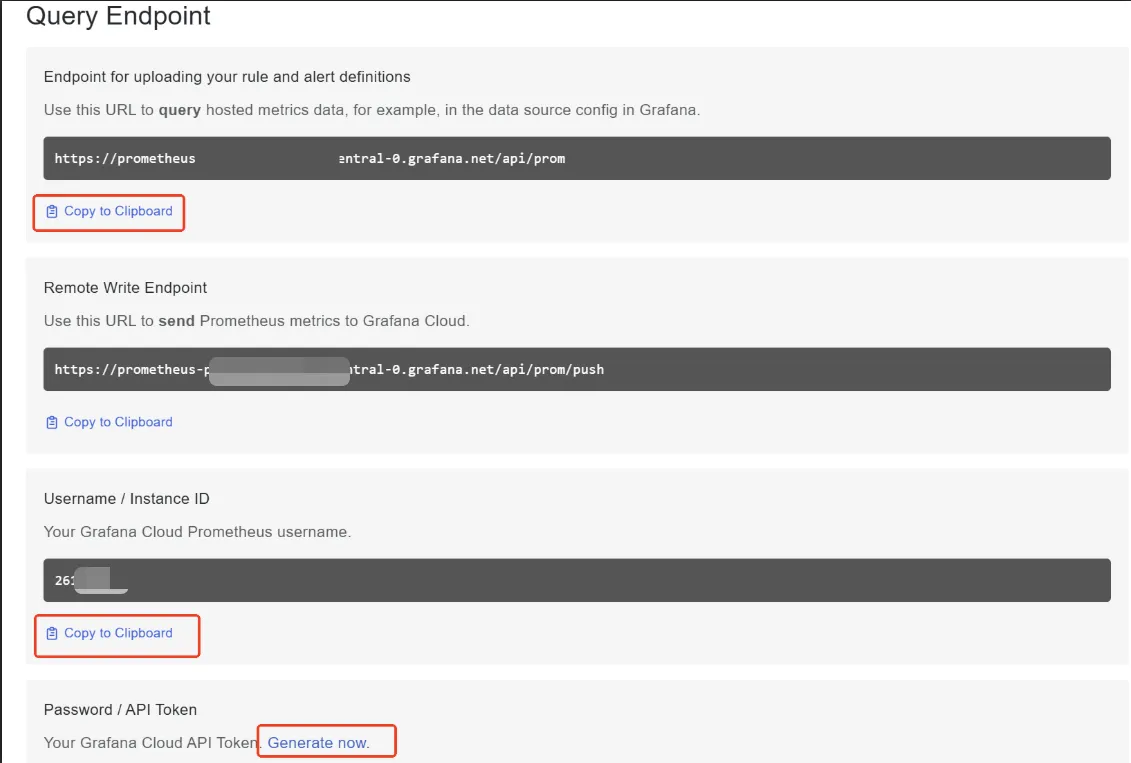
- Scroll down to
Query Endpointsection. - Generate an
Passwordif you don't already have one. - Copy and paste the following values into the corresponding fields:
Query URLvalue intoPrometheusAddressfield;Usernamevalue intoPrometheus Usernamefield;Passwordvalue intoPrometheus Tokenfield.